
Published 2025-04-14 by Tim Swena
Nothing stings quite like watching your carefully nurtured seedlings wither after an unexpected frost. When temperatures drop below freezing, the water inside plant cells expands, bursting them—a death sentence for tender greens. But what if you could tilt the odds in your favor?
 Data keeps seedlings safe from freezing weather.
With a bit of mathematics (or by visiting OvercastData.com, where we’ve crunched the numbers for you), you can minimize the risk of frost damage and maximize your growing season.
How to find your frost dates (no math required!)
For gardeners and farmers who just want the answer:
- Visit OvercastData.com.
- Search for your location (e.g., Chicago).
- Scroll to the Frost & Freeze Dates section.
👉 Pro Tip: Bookmark your location’s page and revisit annually—OvercastData.com recalculates frost probabilities as new data comes in.
Why this matters: My wife and I struggled with conflicting advice about Chicago’s last frost date. We checked several resources but the predictions varied by over a month. Now that my team and I have added the frost calculator, we know there’s a 95% chance our balcony lettuce, beets, and carrots will be safe if we move them outside after May 19. Your dates will vary—check your last freeze dates!
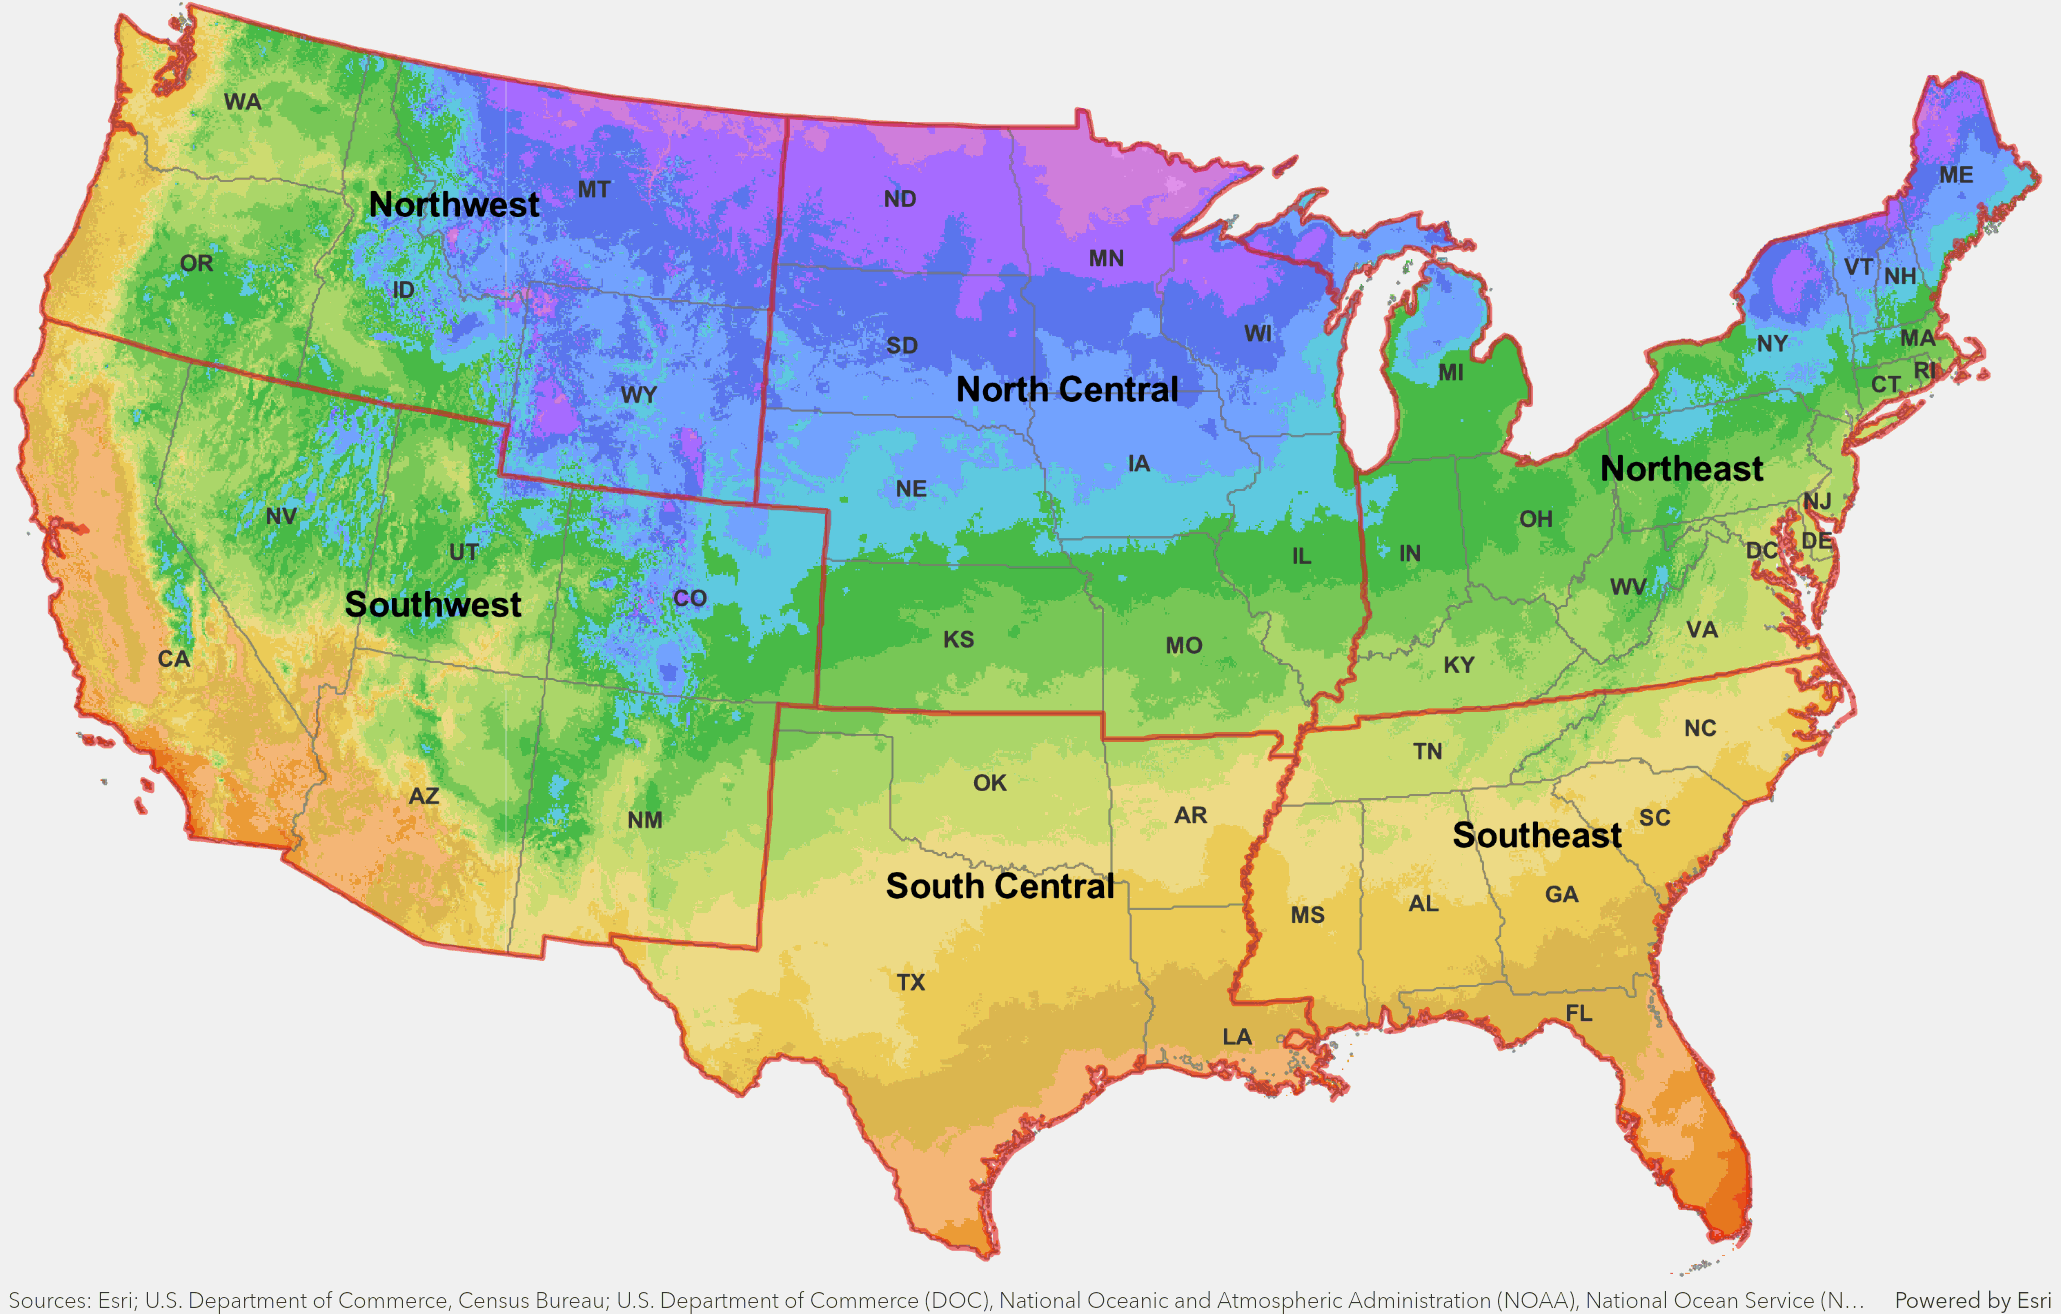
A map of plant hardiness zones from the United States Department of Agriculture (USDA)
For those curious about the 'why' behind these dates, read on!
The mathematics behind frost predictions
Plants take time to grow. For example, some varieties of corn (maize) need 100 days to mature and don't tend to be very frost tolerant, whereas some beets can grow in 50 days and tolerate a light frost. So when should you plant?
What are the first and last frost dates?
It's important to be precise about what OvercastData.com is trying to predict. The USA National Weather Service defines frost, freeze, and hard freeze in the following way:
FROST
Frost occurs when there is a solid deposition of water vapor from the air. Frost will form when solid surfaces are cooled below the dew point. An air temperature range of 33°- 36° Fahrenheit (or colder), along with light winds, is usually needed to initiate frost formation. At least minor damage is possible to plants. One must keep in mind that frost is not guaranteed if the air is very dry and/or winds are roughly 8+ MPH.
FREEZE
Freeze occurs when the temperature drops to 32° Fahrenheit or lower. A freeze will result in significant damage to many unprotected plants, especially if the temperature remains at-or-below freezing for several hours.
HARD FREEZE
Hard freeze typically occurs when the temperature reaches 28° Fahrenheit or lower for at least an hour (or more). This usually means that most seasonal vegetation will be destroyed. In addition, there is a possibility of damage to unprotected outdoor plumbing/un-drained sprinkler systems etc.
For the purposes of this article, I focus on how you can find the freeze dates, specifically the last freeze date in spring. This means that you'll be calculating the last day in the season where the low temperature drops below 32 °F (0 °C).
Using probabilities to predict freezing temperatures
There's a lot of uncertainty with the weather, especially when it comes to making predictions about how this year's growing season will be. For this reason, OvercastData.com provides probabilities associated with first and last frost dates. Understanding these probabilities can help you make informed decisions to protect your precious plants, optimize your planting schedule, and ultimately increase your harvest.
Simplified model: constant freeze risk
To get more comfortable with the probabilities that OvercastData.com uses, imagine a world where each day’s temperature is determined by a dice roll:
- Roll a 1? Freeze (plant dies).
- Roll 2–6? Safe.
How would the corn seedlings fare in such a world?
In this dice simulation (powered by Tabletop Simulator), the corn dies after only 3 days!
This graph shows the lifetime of the seedlings across many simulated seasons, with the horizontal axis showing the number of days into the spring thaw season and the vertical axis corresponding to how many crops lived to that age before freezing.
After 10 million simulations, most die after a few days and almost none survive past 40 days. The oldest lasted 86 days before a freeze. None of the corn made it to 100 days in this simulated world.
What's the chance that a corn plant survives to "x" days in this world? For a plant to live x days, it must avoid freezing every single day. That's \(P(survive) = (5/6)^x\), because the probability of surviving each day is \(5/6\), and these probabilities are multiplied together for each consecutive day.
To make it to 100 days, there is a \((5/6)^{100}\) probability of 100 days of no freezing temperatures. There's about a 1 in 83 million chance of happening. Not great for our farming prospects!
Real-world model: variable freeze risk
Now try a model that reflects real life a little more closely. The probabilities you'll use take inspiration from the freeze probabilities that overcastdata.com calculated for Chicago:
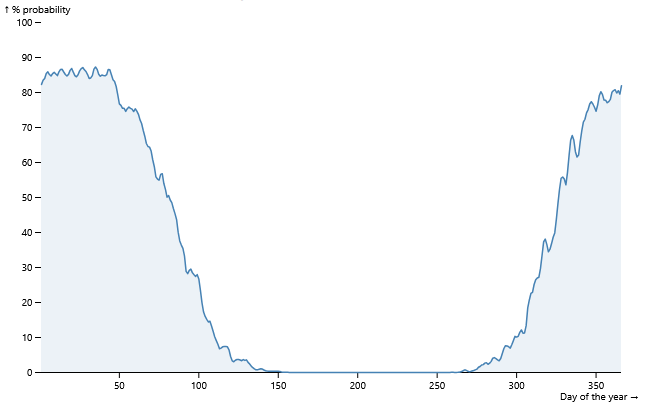
This graph shows the probability of freezing temperatures for each day of the year in Chicago. The probabilities hover around 90% during winter and then drop to almost 0 over the course of about 90 days.
Simplify this into a model. Assume the probability of freeze starts at a \((99/100)\) chance of freezing on the first day of the spring thaw season. On the second day, you have a \((98/100)\) chance. On the third day, there's a \((97/100)\) chance, and so on. On the 100th day, the chance of a freeze is 0 and it never freezes for the rest of the season.
What happens with this model in some different scenarios? First, if you plant on day 1, that's a \((99/100)\) chance of freezing. If you roll a 100 sided dice, you have to roll a perfect 100, which is 00 and 0 if using percentile dice, for your plants to survive the night. The next day, you have to roll a 100 or a 99 or else your plants are doomed.
What about when you start at day 50 of our 100-day spring thaw season? You have to roll 51 or greater on a 100 sided dice. The next day you have to roll 50 or greater, then 49 or greater, and so on.
If you repeat this for many simulations, here's what the simulated plant lifetimes look like if you plant on day 50:
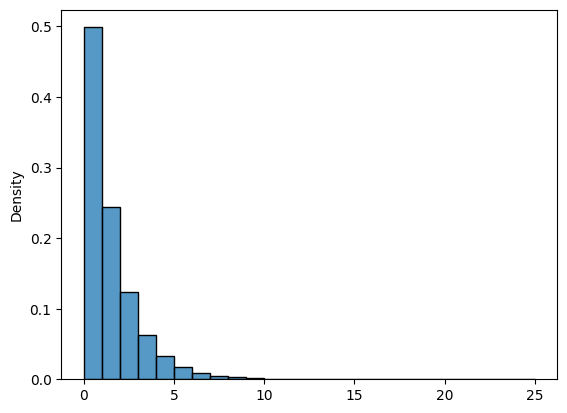
As with the earlier chart, the horizontal axis shows the number of days in the growing season and the vertical shows the number that survived to that day.
Half of the crops freeze on the first day, and it doesn't take long for the rest to freeze after that. The longest any plant made it in these 100,000 simulations is 22 days after planting.
Rather than continuing to guess, take a look at the last freeze date in 100,000 simulated seasons or more than 10,000,000 percentile dice rolls.
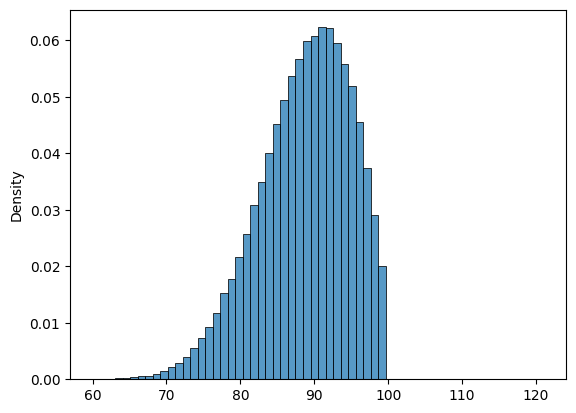
In this graph, the horizontal axis shows the day of the season and and the vertical showing how many seasons had the last freeze date on that day. The peak of the curve around day 90 indicates that this is the most likely time for the last frost in this simulation.
The last freeze date data form roughly a bell curve, but with a hard cutoff at day 100 due to the probability of freeze dropping to 0. If you want to make sure you have at least a 50:50 shot at your corn making it to maturity, when should you plant?
There's a few ways to calculate this. OvercastData.com uses these techniques:
- Average the historical last freeze dates. The median is the date where 50% of the time the last freeze date was before then, so it's a 50:50 chance that it's safe to plant.
- Use daily average freeze probabilities and work backwards from summer until you get to the desired risk of freezing. The chance of a particular day \(i\) being the last frost date is the chance it freezes on that day and the all of the days following do not freeze: \(p_i (1 - p_{i + 1}) (1 - p_{i + 2}) ... (1 - p_{200})\).
Essentially, you're calculating the chance of a freeze happening on a specific day AND no freezes happening after that.
In this constructed world of rolling percentile dice, these two techniques give the same answer: around 87 days. Your results may vary, especially with the median technique, because the last freeze dates can change based on the roll of the dice.
You can also use these data to find the 95th percentile last freeze date to give yourself only a \(1/20\) chance of your crops freezing. In this case, that's day 96 of the simulated thaw season. If you plant on day 96, then you'd need to roll a 5 or greater, then at least a 4, 3, and finally at least a 2 on day 99. After that, you're in the clear for the season on day 100 and beyond.
Because the timing of the last freeze can vary from year to year, OvercastData.com prefers the more flexible probability-based method. It allows us to incorporate more recent weather patterns, though this comes with the added complexity of accounting for how temperatures on consecutive days might be related (temperature dependence).
How are per-day freeze probabilities calculated?
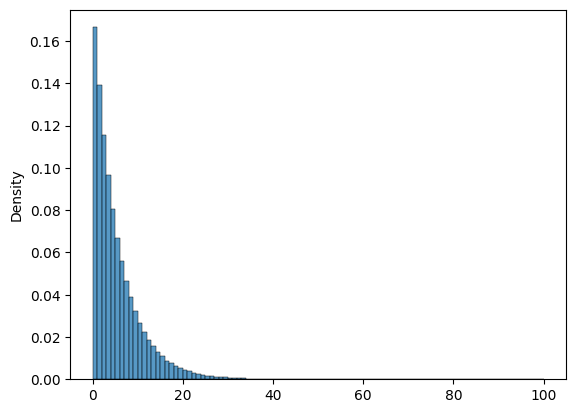
OvercastData.com assumes that for a given location at a particular day, temperatures normally distributed around the average temperature. If you compare all weather stations with at least 20 years of data in the NOAA GSOD dataset, the temperatures do form a pretty clear, but not perfect, bell curve, also known as a normal distribution:
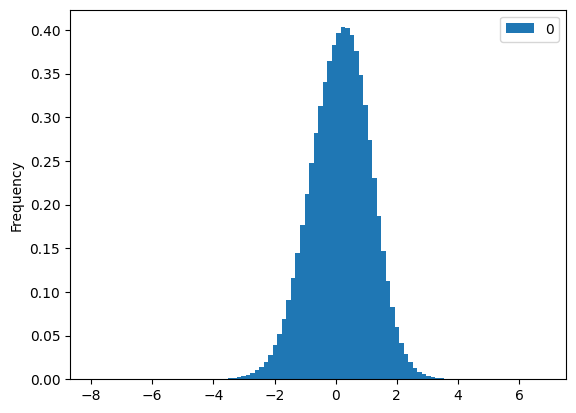
In this image, the horizontal axis is measuring how far from the temperature is from the average, scaled by the standard deviation.
OvercastData.com calculates these averages separately for every day of the year across every station in the world. For example, we take all the low temperatures measured on February 18 in central Illinois over all the years of data and calculate:
- Mean (avg) low temperature for each day of the year at the location.
- Standard deviation, which measures how much low temperatures vary from year to year.
These parameters provide the shape of a normal curve. By calculating the area under the curve below the freezing point of 32 °F (0 °C) with the cumulative distribution function or cdf, OvercastData.com determines the probability that the temperature dips below freezing.
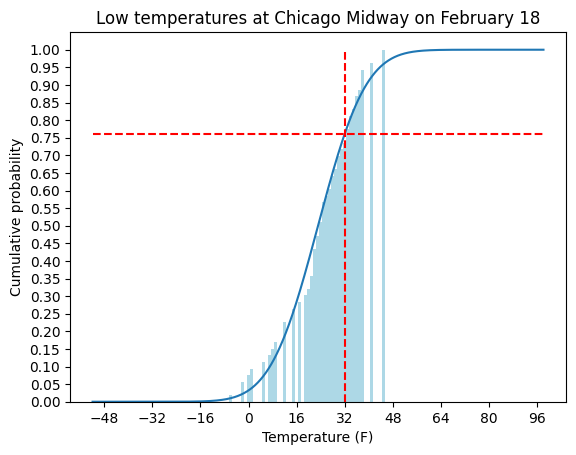
This chart shows the cumulative proportions of low temperatures at Chicago Midway on February 18 and the corresponding cumulative distribution function. The probability of a freeze is about 75% on this day.
Once OvercastData.com has calculated the freeze probabilities for every day of the year, we use them just like you did in the calculations above, with the dice roll probabilities. In this case, the real world data determines what you have to roll on each day of the rest of the season to prevent your plants from freezing.
Key takeaways for your garden
-
For Gardeners/Farmers:
- Use OvercastData.com to find personalized frost dates.
- Plant after the 95% safe date for risk-averse crops (e.g. tomatoes, corn).
- Early crops (peas, kale)? The 50% date may suffice.
-
For Math Lovers:
- Frost prediction blends probability and real-world distributions (like the normal distribution), utilizing the cumulative distribution function and numerical techniques.
- Try simulating your own models using this Python notebook.
Final thoughts: data feeds the world
None of this would be possible without data. Our ability to make more informed gardening decisions relies on the wealth of historical weather data collected by organizations like NOAA.
Whether you’re a gardener, farmer, or math enthusiast, understanding frost probabilities helps us all grow smarter.
Ready to plant with confidence? Check your frost dates at OvercastData.com!